![]()
“. . . by the 1990s fishery biologists had ably demonstrated that federal dams accounted for more than 95% of salmon losses on the Columbia/Snake system. Of course, biologists had known that for years.” K. Petersen, River of Life, Channel of Death (1995).
Why do we read in newspapers, magazines and books that dams kill 95% of the salmon? This is perhaps the greatest hoax perpetrated by fishery advocates, ranging from environmentalists, to commercial fisherman, and, most regrettably, to the fishery agencies of the States of Oregon, Washington, Idaho, and Alaska. Long after federal fishery officials had recognized that these figures were wrong (although remaining mum about it), fishery officials like Oregon's Doug DeHart continued to repeat the 95% figure to the media. Books and legal opinions echo the figure as well.86
Strong willed biologists working for the U.S. Army Corps of Engineers Walla Walla office grew so tired of hearing this lie repeated over and over again that they prepared a special "Information Paper"—"Not True says Corps Review!".87
As the Corps explained, the 95% figure traces back to Congressional testimony by the godfather of salmon advocates, a man named Ed Chaney who continues, according to legal papers filed on his behalf, to derive substantial economic benefit from contracts associated with salmon advocacy. When questioned by the Corps about the source of the 95% figure, "Mr. Chaney replied that all the state agencies were using the figure, so it must be true".
After an exhaustive review of fishery research, the Corps did come up with one scientific study by Raymond, estimating that in one year, 1973, 95% of the salmon migrating from the Salmon River perished before they reached The Dalles Dam.88 As the Corps explained, most of these fish perished before they ever reached the first dam (Lower Granite):
"In recent years, an average of 50 to 60% of the hatchery chinook have been lost before they reach Lower Granite Dam. More surprising, in PIT tag studies by the federal fishery agencies, 80 to 99% of wild fish marked in the summer did not survive to Lower Granite Reservoir the next spring."89
This suggests that a great deal of the mortality Raymond measured had nothing to do with the dams. Moreover, though the Corps did not point this out, because it was not known at the time, Raymond’s estimates were compromised to begin with because of very significant flaws in estimation techniques.90 (These problems are discussed in more detail in Chapter 7.)
The Corps also pointed out that back in 1973, the dams had not yet been modified to protect fish in very significant ways:
"In 1973, seven dams were in place, with a total of 65 turbines in operation. Only one turbine was screened at Little Goose Dam for experimental purposes. In 1994, eight dams are in place with 94 turbines operational. All of the turbines at Lower Granite, Little Goose, Lower Monumental, Ice Harbor, McNary, John Day, and Bonneville Dams are screened. Two of 22 turbines at The Dalles Dam are screened, with full screening due in 1998."91
The Corps also pointed out that "in 1973, turbines were operated at 115% rated capacity with an average of 15% mortality through each turbine. In 1994, turbines will be operated within 1% of peak efficiency which decreases turbine mortality to less than 10%".92 (Again, the more recent balloon-tag studies show less than half that mortality.)
As Drs. Chapman and Giorgi have explained,
“It is too easy to forget that in the 1960s and 1970s, there existed no accepted operating criteria for turbine operations to assist fish passage. Bypasses were at rudimentary stages and hardly fish-friendly. Debris at trashracks and in collection systems was a severe problem.”93
But the dams have been modified to be much safer for fish since the 1970s.
Finally, as the Corps explained in its paper, not only had in-river survival increased, but also the transportation program had dramatically increased the "system survival"—the total average survival of in-river and transported fish—since the 1970s. As they explained, "in 1973, insignificant numbers of fish were transported, compared to over 80% being transported in the 1990s".94
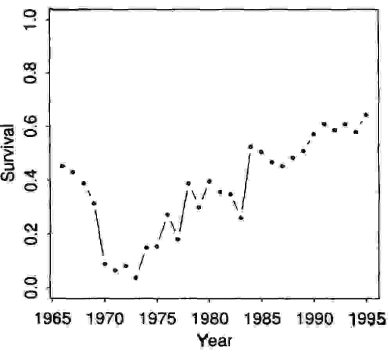
The net effect of all these changes was substantial. Professor Jim Anderson at the University of Washington has used sophisticated computer modeling techniques to plot the gradual increases in survival:

Figure 15: CRiSP Estimates of Survival Improvements95
For the most part, critics have completely ignored the improvements. The media does not report them. Leading politicians ignore them. “Vice President Gore has written, in Earth in the Balance, that journalists should downplay scientific findings of ecological improvement because good news may dilute the public sense of anxiety.”96
Even the more perceptive critics lament that “given the gravity of the situation, the changes were modest; they failed to achieve their goal”.97 But given all the other factors working against salmon, fixing the dams could never, by itself, achieve the goal of improving salmon runs. A goal of bringing back salmon by removing or improving dams is a goal that can never be achieved.
86 See, e.g., R. White, The Organic Machine 102; J. Cone, A Common Fate 127; K. Petersen, River of Life, Channel of Death 169.
87 Information Paper, "Subject: Federal Dams cause 95% of the Human-Caused Mortality to Snake River Salmon—Not True says Corps Review", May 1, 1994 (USACE Walla Walla District).
90 See, e.g., J. Williams & G. Matthews, “A review of flow/survival relationships for juvenile salmonids in the Columbia River Basin”, manuscript submitted to Fishery Bulletin (NMFS CZESD March 1994).
93 D. Chapman & A. Giorgi, “Comments on Work of Biological and FCRPS Alternative Work Groups”, at 8 (1994).
95 From Chart presented by Dr. James Anderson at CRA Salmon Symposium, Nov. 19, 1996.
96 G. Easterbrook, Earth in the Balance xviii.
97 R. White, The Organic Machine 103.
This Web page was created using a Trial Version of HTML Transit 3.0.