![]()
Certainly the construction of some dams has had an enormous adverse effect on salmon, and for this reason it is easy for salmon advocates and the media to assign blame to dams. This blame is a central component of the Great Salmon Hoax. Some who know the truth persist in what one writer has called “framing the guilty”—using misleading information and outright lies to cast the blame unfairly. As liberal environmental reporter Gregg Easterbrook acknowledged, “[f]raming the guilty has become a central operating tactic of environmentalism . . .”49 He thinks it is “sometimes defensible”.50 I don’t think it ever is.
Rob Walton works for the Public Power Council on salmon issues. He recently attended a dinner party where, after learning his occupation, one of the guests blurted out "I just think we ought to take out all those dams. I don't want my children to grow up without salmon". This sort of thinking is common among citizens throughout the Pacific Northwest, at least in the large metropolitan areas far from the dams. Most people have never bothered to think through the details of how dams affect salmon. They have a simple theory for blaming dams: over time, we have built more dams and salmon populations have dropped, so dams must be killing salmon.
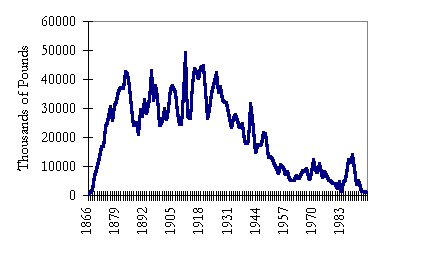
One of the favorite graphs used by those who perpetrate the Great Salmon Hoax is the graph of commercial salmon harvest in the Columbia River. James Lichatowich, one of many conservation biologists urging removal of the dams, has even used it four times in a single paper.51

Figure 11: Columbia River Commercial Salmon Harvest
As the National Research Council has pointed out, “casual readers might assume that the depiction of reduced catch reflects the magnitude of the decline of salmon in the Columbia River without recognizing that in-river catch has been largely supplanted by large ocean fisheries”.52 Failing to transcend the status of “casual readers”, the Northwest Power Planning Council’s Independent Science Group prepared a “Harvest Summary of Chinook Salmon” declaring that from 1958 to the present, harvest has been at “a depressed level of production of about 5 million pounds”.53
There is some possibility that until quite recently, the decline in in-river harvest masked a rise in overall harvest. The Northwest Power Planning Council reported in 1986 that “Columbia River chinook salmon caught in ocean fisheries (including Canada and Alaska) now account for about 73 percent of total harvest”.54 I really would have liked to put in this book a single graph showing the total harvest rate on the three endangered Snake River stocks of fish, showing how, over the years, rising ocean harvests replaced in-river harvests, and fishery managers never came to grips with overfishing until the mid-1990s—if then.
Unfortunately, the only analysis I have ever seen that attempted to figure out whether ocean fisheries had risen to take the place of in-river fisheries was prepared by Dr. Courtland Smith back in 1979. He compared chinook salmon catches from 1969 to 1973 in several fisheries to the 1880 to 1930 average catch of 26.4 million pounds of chinook salmon. By 1969-73, the catch in the gillnet fishery had fallen to 5.2 million pounds. But catch in the troll fisheries had risen to 8.1 million pounds. And Dr. Courtland made a statistical adjustment, usually ignored, to account for the fact that the fish caught by trollers were immature and, had they been caught at maturity, would have been larger. This adjustment alone accounted for 4.2 million pounds of salmon. Dr. Courtland then added in the recreational fishery, taking 5.2 million pounds of fish, and the tribal fishery, taking 1.3 million pounds.
The result: from 1969 to 1973, the total catch of Columbia River chinook salmon was 90% of the historic amounts.55 Personally, I think it was higher than the historic peaks, because Dr. Courtland left out three critical factors. He left out “the shakers”—fish lost because they were shaken off the hook as too small. At the time, shaker loss was estimated at 7.5% of the total catch, which would have added an additional 0.9 million pounds of loss associated with trolling.56 More modern estimates suggest that perhaps 25% of chinook salmon die after being caught and released in the troll fisheries, which represents another enormous inefficiency in ocean harvest.57 Perhaps 30% of chinook salmon die after being caught and released in the Puget Sound commercial purse seine fishery.58 Dr. Courtland’s estimates also ignored all catches by foreigners other than Canadians, which many, especially domestic trollers, believed were substantial at the time.59 And Dr. Courtland did not attempt to assess the quantity of Columbia River salmon discarded as bycatch in non-salmon fisheries.
If these three factors are taken into account, it is possible that up until the 1990s, chinook salmon from the Columbia River Basin were harvested as heavily as ever. This is a stunning tribute to the success of hatcheries, but the heavy mixed-stock harvest pressure doomed less productive wild runs.
Another problem with the “blame the dams” theory is that upriver salmon populations increased for several years in the 1980s after the last dam was in place. The very wild fish now listed as endangered increased in numbers for several years after the dams were all in place. There was better weather in some of those years, but the fact that the population can rebound like that certainly suggests that dams are not going to jeopardize the continued existence of the salmon.
That rebound is even more significant when you consider the degree to which a number of factors of salmon decline have accelerated since 1975. One of the many inadequacies of the fisheries agencies is their inability to present a coherent set of data for salmon management. Because so many agencies are involved, there is no place to look up total salmon harvest information, much less harvest by stocks.
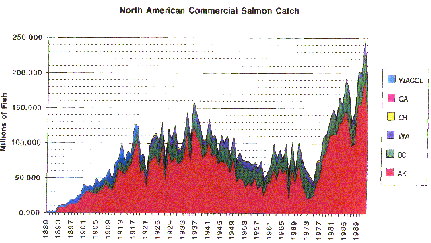
One of my clients hired a consultant to dig up total harvest numbers. The consultant assembled all the different harvest figures from a great number of official sources. The resulting total numbers show a dramatic increase in Pacific Northwest salmon harvest, beginning almost exactly after the last dam was completed in 1975.

Figure 12: West Coast Salmon Harvest
This chart has its limitations. It includes all salmon species, not just chinook salmon, and salmon from all over the West Coast, not just the Columbia River Basin. Most of the increase has been in Alaska. It does not include foreign harvest of U.S.-origin salmon.
If I knew where to look up overall harvest, including Canadian, Alaskan and foreign harvest, on Columbia River stocks, I would present that chart. But as far as I know, the data are not reported anywhere. It is not clear that the harvest managers have even collected sufficient data to produce reasonable estimates of the total harvest of Columbia River fish. They have long failed in their most basic role: figuring out who has caught how many fish from where.
Nevertheless, this chart suggests a significant expansion of overall fishing effort after 1975, just as the last mainstem dam was finished. The “coincidence” of a rise in harvest was not limited to ocean harvest.
The number of gillnet licenses issued annually on the lower Columbia River rose from about 600 in 1969 to about 1,500 in 1979.60 And as we have seen, tribal chinook harvest rose very rapidly after 1975.
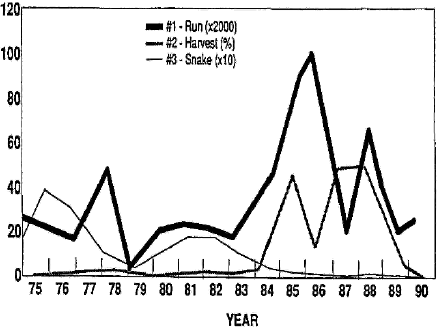
There is some evidence that harvest increases after 1975 were a particularly significant factor rendering the Snake River sockeye salmon an endangered species. Although in-river commercial harvest on sockeye was curtailed from 1974 to 1983, it began again in 1984. Dr. Graham Gall, of the University of California at Davis, has prepared a graph showing how rapidly rising harvest levels on sockeye in the 1980s, including substantial tribal harvest, affected endangered Snake River sockeye salmon:

Figure 13: Sockeye Harvest after 1975
The Snake River sockeye were clearly in trouble, but fishery agencies continued to harvest nearly half of them in the river because the total sockeye runs were rising. Most of these sockeye were killed to be sold for commercial gain, not for sport fishing or tribal “ceremonial and subsistence” fishing. An unknown number, not shown on this chart, were also taken in the ocean.
The increased in-river harvest in the late 1980s was one of the many products of the court-dominated regulatory scheme that arose from the case of United States v. Oregon. Ironically, some environmentalists and politicians now herald this process as the governance model for future salmon recovery decisions. The States of Oregon and Washington have actually filed formal court papers asking the United States v. Oregon Court to take over.
49 G. Easterbrook, A Moment on the Earth 117; see also I. Suggs, “Defenders of Wildlies?”, CEI UpDate, Feb. 1997, at 1 (citing G. Hodges, “When Good Guys Lie”, The Washington Monthly).
51 J. Lichatowich, “A History of Frameworks Used in the Management of Columbia River Chinook Salmon”, at 4, 14, 30, 47 (May 1996).
52 NRC, Upstream at 69 (Prepub. ed.).
53 ISG, Return to the River 93.
54 “Compilation of Information on Salmon and Steelhead Losses in the Columbia River Basin”, Appendix D of the 1987 Columbia River Basin Fish and Wildlife Program, at 5-6 (NWPPC Mar. 1986).
55 C. Smith, Salmon Fishers of the Columbia 100.
56 Id. at 88 (shaker loss excluded because the “calculation is tenuous and subject to considerable controversy”).
57 A. Wertheimer, “Hooking Mortality of chinook released by commercial trollers. North Am. J. Fish. Mgmt. 8:346-55 (1988); A. Wertheimer et al., “Size-related hooking mortality of incidentally caught chinook salmon, Onchrynchus tshawytscha”, NMFS Fisheries Review 51(2): 28-35 (1989).
58 "Commercial fishermen take too many chinook, state says", The Oregonian, Oct. 29, 1997.
59 C. Smith, Salmon Fishers of the Columbia at 90.
60 “Compilation of Information on Salmon and Steelhead Losses in the Columbia River Basin”, at 125 (Figure 18).
This Web page was created using a Trial Version of HTML Transit 3.0.