The right to cross-examine witnesses is one of the great rights that citizens of the United States once enjoyed, for cross-examination has been aptly termed the greatest engine for the discovery of truth ever invented. Witnesses of all types routinely shade their testimony, and their creativeness is tempered, if at all, by the fact that they may be placed upon the witness chair and asked to explain themselves.
On November 20, 2002, I was privileged to have the opportunity to cross-examine a government expert witness in the case of Columbia Snake River Irrigators Association v. Washington Department of Ecology. The irrigators were suing because the Department had failed to act on their applications to appropriate water from the Columbia River for more than a decade. Most such cases would never go to trial; the Federal courts routinely decide challenges to agency inaction by "summary judgment", in which the courts essentially presume that written statements submitted from government experts are true.
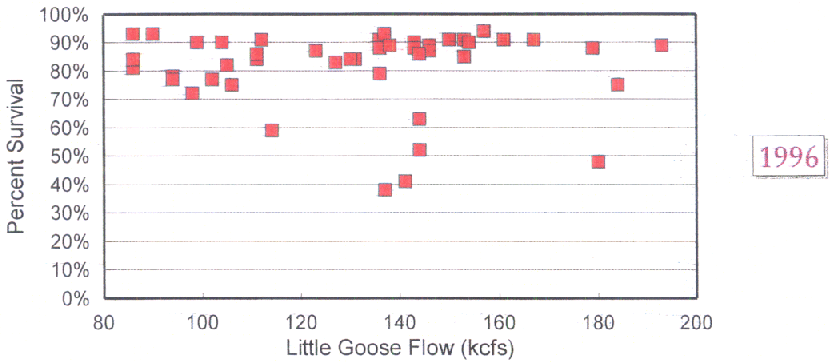
But live witnesses often tell a very different story than the one that emerges from papers prepared by Justice Department lawyers. In this case, the Department's excuse for failing to process the water rights applications was imagined fear to salmon from draining a microscopic percentage of the mighty Columbia River. The irrigators were armed with a large number of studies showing that appropriating the water would cause no harm to fish. One such study charted the relationship between river flow and salmon survival as follows:
Now any ordinary citizen can look at this data, and tell that if there is any relationship between flow and survival in this data, it is a negative one: the higher the flow, the lower the survival. The Department's expert, Dr. W. Douglass Shaw, of the University of Nevada, however, saw things differently, provoking the following cross-examination (edited for brevity; the italicized portions are my editorial comments):
Q:
I believe you said that you agreed that one of the starting points for
looking at [the relationship between river flow and salmon survival] would be .
. . ordinary least squares analysis comparing flow and survival, correct?
A:
Yeah. I think it would be a
reasonable place to start for sure.
Q:
Okay. Now, in your capacity
and knowledge of econometrics and statistics you've had occasion to look at many
many data sets of many many different types, correct?
A:
Correct.
Q:
And . . . as part of your practices and procedures you'd look at the raw
data of this sort in the course of assisting yourself in designing a particular
statistical analysis technique, wouldn't you?
A:
Right.
Q:
Okay, and over time you would develop a facility by looking at the raw
data to be able to discern whether there's some sort of relationship among the
variables, correct --
A:
Correct.
Q: -- in a general sense? So, for example, if we were to look at the bottom graph here with 1996, you would agree with me that any sort of statistical technique that we would apply to this 1996 data to fit a linear or indeed any kind of relationship between these two sets of data would tend to produce something that drooped down over the course of the graph as we went to the right, wouldn't it?
Here
I ask Dr. Shaw to admit that the only relationship one could draw from the data
would be a negative one; higher flows are associated with lower salmon survival.
A:
I actually wouldn't arrive at any conclusions whatsoever on these three
graphs. They're very misleading
potentially.
Q:
Well, I know that. It is
always misleading to look at a tiny subset of the data, and I know that there
are hundreds and hundreds of data sets, and in some of them the clouds of dots
will point down and in some of them the cloud of dots will point up, but I'm
asking you about the bottom one here [reproduced above], if we fit this
with a statistical technique, we would show a decreasing [relationship between] survival and flow.
More flow is less survival, correct?
A:
Uh, gosh, I just wouldn't do it. I'm
not willing to say that.
Q:
Okay.
A: Scatter diagrams are just -- they sometimes can reveal something, but there's enough noise, what I would call noise in this picture that I would be a little . . .
Q:
With all due respect I don't think you're answering the question.
The question was more of an abstract econometrics question.
You can't sitting here today fathom some sort of distribution, some sort
of estimation technique, any type of thing that you could apply to this
particular set of data and get out a positive relationship between flow and
survival can you, [based on] this data alone -- however misleading that may be?
A:
I just -- I just am not comfortable testifying to that.
Q:
Well, you're the expert. What
kind of statistical distribution or technique would we use to get a positive
relationship out of this data?
A: Oh, I wouldn't ever embark on a statistical analysis with the mission of getting a particular result.
Q:
I'm not asking for a mission.
A: Yes, you are. You asked me did I -- could I do it to get a positive result. That's saying I know what result I want to get at the outset. I do not know what the relationship is.
Q:
I don't want you to have any presuppositions at all. I want you to tell me whether you can imagine or point to a
specific statistical technique from somewhere in the vast literature of
econometrics which you could apply to this data and get a positive relationship
out of it.
A:
Uh, can I back up a little and say how I would proceed to use this data?
Q:
No. I'd rather you answer
the question.
A: Okay. Then the way you've asked it, yes, I can envision a possible analysis to undertake where it ended up that the outcome was showing some positive relationship.
Q:
From this data alone?
A:
Yes.
(Here, after several unsuccessful attempts to evade the question, Dr. Shaw walks out on the end of the limb by giving plainly false testimony.)
Q:
Okay. How would you do that?
A: The first thing in assessing the data would be -- I would have to understand what does the block mean. What does percent survival mean. How was that data obtained. How is it that you have a whole bunch of blocks for one year. Now, I don't know the answers to those questions . . .
Q:
I believe that Doctor Olson testified that these are from cohort release
groups at Lower Granite Dam, and so we can see that over the course of a set of
time over this year that is put forth in this graph here we released a number of
cohorts and they experienced different flows and different survival.
So, we have that established as a non-hypothetical fact.
Q:
Do you need more clarification, Doctor Shaw?
A:
Yes.
Q:
Okay, what do you need?
A:
Each block, are they all fish that are counted at one location on the
river?
Q:
I will ask you to assume for the purposes of the hypothetical that they
are released in one block at lower granite and therefore counted there, and then
detected down the river at different dams.
A:
Okay. So, the point where
they're counted to ascertain the survival rate is at different locations on the
river?
Q:
It may well be, yes.
A:
Okay. Then the second
question are the blocks obtained, the data that form the blocks, obtained at
different points in time during the year? In
other words, different months? Different
dates?
Q:
Obviously, yes.
A:
Okay. Let me think if
there's anything else I need to know. Yeah,
I would probably ask is the procedure used to count the fish exactly controlled
so that we know it's identical at every single point on the river where the fish
were counted?
Q:
Oh, it's an automated mechanism. They
do the best they can.
A:
Are there errors in their counts?
Q:
No biological sampling is perfect as you well know.
A:
All right. So, each block
may have some error associated with it itself.
Q:
Indeed.
A: Okay. All right. Okay. I think that's giving me enough information now.
Q:
What particular statistical technique do you apply that you believe would
produce a positive flow/survival relationship out of this particular data set?
A:
Again, I would never answer a question where you said I have to get a
positive relationship. If you want
to ask me what statistical method would I use to analyze the data I can answer
that.
Q:
Well, then we've gone around in a big circle here because the first
question I asked you was can you conceive of any type of statistical analysis of
this particular data set that would produce a positive relationship.
A:
And I said, yes, I could conceive of that.
Q:
Okay, what is it?
A: Okay. In the literature in economics we actually borrow a technique that is very sophisticated, and we borrow that from biostatisticians and that's called a survival function approach. A: survival function approach is a very nonlinear, very sophisticated econometric method to analyze the kind of data we're looking at here. It typically does not have a normal distribution. It typically would not look at a very simple relationship between two variables only, such as you've depicted here. A: modification to a survival model would also then allow for the possibility that what you have here is a situation where you have essentially a time series of data. So, for each observation in statistical analysis you measure these things with what we call error. Complicating this problem almost certainly are the fact that the errors are gonna be correlated over time. That means almost certainly that ordinary least squares regression would be inappropriate. So, I would embark upon -- the methodology I would probably embark on would be the basic survival model using what we know from time series analysis about possible correlations of the errors throughout time, and that would be a fairly complicated analysis to do.
(Here
Dr. Shaw tries the common "expert snow job" technique, throwing out a
lot of complicated concepts in an attempt to confuse the questioner.)
Q:
But I haven't given you that data. I've
given you a two-dimensional set of data with flow and survival, and I've asked
if there is any statistical technique you can apply, any model whatsoever, that
can rationally be fit to this data that provides a positive flow/survival
relationship.
A:
Yeah. Another thing I didn't
mention about this data I would probably work with scientists to say when we
look at these data are there any what we call outliers, and okay, and outliers
are data points where we've got pretty good reason to expect that there's
something weird that happened in the data collection process or very strange
anomaly, and it's not uncommon to kind of discount outliers.
There are, in fact, informal procedures for that.
So, for example, if you want to arrive at a result because you see a
particular pattern, I could say well the one that is the cluster right at
140,000 CFS and 40 percent survival, boy, that's kind of down there by itself.
Gee, I wonder if that's an outlier, and especially the one at 180 and 50
percent. It's kind of hanging
around there by itself. So, I'd
probably want to know first before I did anything, you know, are those real or
is that something weird goin' on in the data there and that kind of thing.
Q:
Doctor Shaw, with all due respect I'm not allowing you to throw out some
of the data. I am asking you with
the data that you have here and without throwing out any of it is there any
statistical model using these two variables and this data that you can imagine
that would produce a positive flow/survival relationship?
A:
And I just told you what it is.
Q:
Okay, what is it? Can you
express it grammatically?
A:
I just told you I would use a survival approach with correlated errors,
and I'd run the model and see what happened.
Q:
And what's the function?
A:
Pardon?
Q:
What's the function? Survival
equals what as a function of flow?
A:
Oh. Well, in those models
it's not a linear relationship at all, but you're basically -- sure, you're
still categorizing the model as the survival probability is a function of the
flow. That's the way those models
would work.
Q:
Uh-huh. What's the function.
A:
Right.
Q:
It's a nonlinear function you've told us.
What is it?
A:
Oh, you want to know exactly what it is?
Q:
Yeah. You're the expert. Go ahead, tell me.
A:
Okay. What you have to do in
survival modeling is you have to do what's called parameterizing the independent
variable. The mathematical function
for the probability distribution is probably gonna be exponential.
The reason that it's exponential is that we think most biological
organisms grow exponentially. Therefore what the probability function does is it links
together over the time periods the probability that the fish can survive in a
mathematical form that is an exponential function. Now, it's not as simple as that because the next step is you
have to figure out what's called parameterizing the flow, and when you
parameterize the flow you have to use an assumption about the relationship of
flow in terms of the mathematical affect it has on the survival.
They're fairly complicated models.
(More
"expert snow job".)
Q:
Can we just cut to the chase and just tell me what the function is
instead of --
A:
I just told you. Do you want
me to get up there and try to write it out?
I don't think I can do that right now, but you're asking me to describe
on the witness stand a mathematical function that is fairly complicated.
Q:
Well, you would agree that what we're engaged in here is attempting to
fit a function to the data, correct?
A:
Right.
Q:
Can you draw the line that you would draw through the data with such a
result?
A:
Uh, no, because exponential functions take different shapes depending on
what we call the scale perimeters in the functions, and so exponential functions
actually can have long tails in one direction and the empirical data would help
us determine what's called the scale perimeter and the function and then that
lets me know does that thing look like this (indicating) or does it look like
(indicating), is it flatter than that. They
can actually have very, very different looking shapes by the time you estimate
them with the data. So, that's
actually the beauty of them in a way because the linear regression model that
Doctor Olson used only allows one possibility, and that's a straight line.
The exponential function could take any number of different shapes
generally in the exponential family, and they can have very different shapes.
Q:
And they're all curved, right?
A:
Yeah.
Q:
Okay. Now, you would agree
with me no matter what we're doing if we're fitting a curve to this data it is
going to lie somewhere between the top and the bottom, correct?
A:
Uh, again, my best guess is even if you used an exponential function on
the 1996 data that you used, that you depicted here by itself with no other
data, you're probably not going to fit it with a nonlinear function and find a
very clear picture of any positive relationship, okay?
But the --
Q:
The shape of the curve is gonna be down, correct?
A:
It may be flat.
Q:
Flat or down?
A:
Flat or down.
Thus, after what amounts to eighteen pages of testimony, Dr. Shaw finally contradicts his initial, false testimony: "I can envision a possible analysis to undertake where it ended up that the outcome was showing some positive relationship." The only relationship that can be drawn from the data is flat (no relationship) or down (a negative relationship).
Drawing the truth out of a witness is a time-consuming and often tedious process, though lawyers typically enjoy it. Even in the unusual procedural circumstances where cross-examination is allowed, most judges do not have the patience to allow the lawyer the very large amounts of time needed to pin down evasive experts on any particular point, and there are many, many points to be nailed down. Even in the rare cases where cross-examination is allowed, an evasive expert will provoke most judges to tell counsel to "move along" before he or she can get anywhere near demonstrating that the government's experts are lying.
This case settled, so the Judge never got to write an opinion on the flow/survival issue. As far as I know, no neutral factfinder, whether judge or jury, has ever listened to evidence on Columbia River flows and fish survival, with live testimony of witnesses subject to cross-examination, and then made a decision. We have crippled economic development and wasted literally billions of dollars on measures to manipulate river flows for fish, all the while employing fewer factfinding procedures than we do when a school bully gets expelled. We do this because judges declare that they are supposed to accept the conclusions of government experts without cross-examination. This has produced a culture where government experts routinely lie, because they know they will never be held accountable for it.
Thus we have flow targets that purport to require more river flow than Nature ever delivers, "endangered" species is no danger of extinction whatsoever, and a whole host of other measures foisted upon us by lying experts, accountable to no one.
© James Buchal, March 5, 2003
You have permission to reprint this article, and are encouraged to do so. The sooner people figure out what's going on, the quicker we'll have more fish in the rivers.
![]()
Return to Other Salmon Materials
Return to www.buchal.com